Sample Question
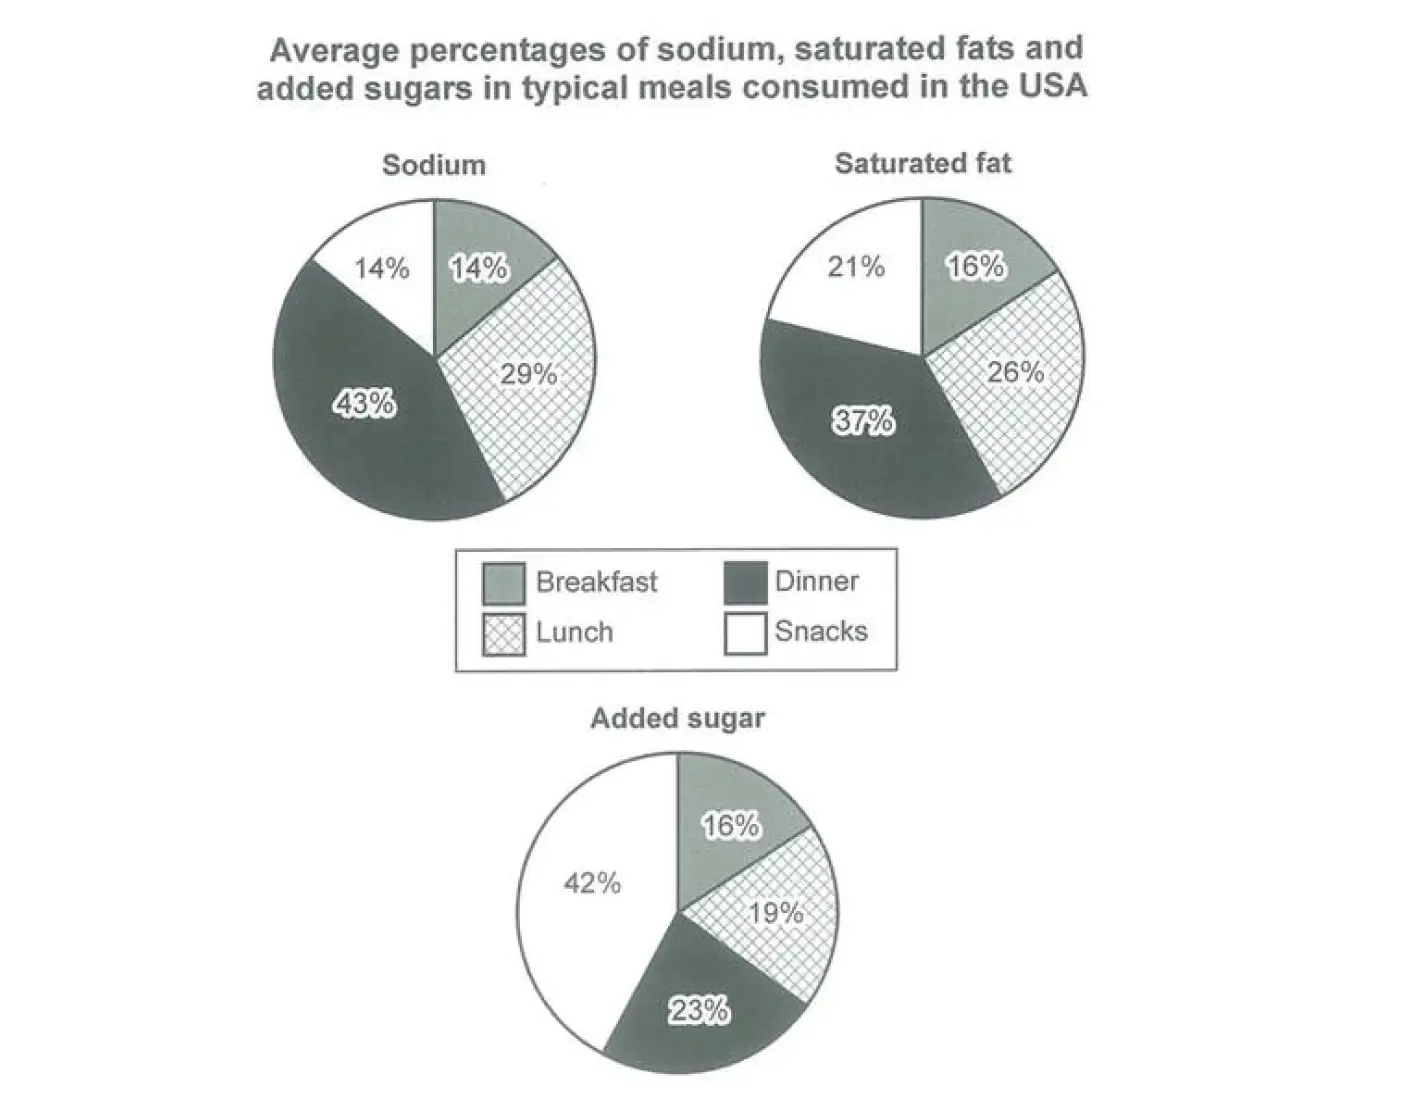
The following question and image are taken from Cambridge 14 Test 1 Writing Task 1.
Related Report: Line Graph
Sample Answer
Word count: 173
Band Descriptor Analysis
1. Task Achievement
The report introduces the three pie charts, identifies the main patterns in the overview and supports its comparisons with relevant figures. It groups sodium and saturated fat together because dinner accounts for the largest shares of both nutrients, while added sugar is discussed separately because snacks have the highest proportion.
- Main patterns — sodium and saturated fat: The overview identifies dinner as the category with the largest shares of both nutrients, supported by figures of 43% and 37%, respectively.
- Contrasting pattern — added sugar: The report identifies snacks as having the largest share at 42%, compared with dinner at 23%, lunch at 19% and breakfast at 16%.
- Relevant supporting details — The body paragraphs compare the proportions for lunch, breakfast and snacks to substantiate the main observations.
The overview prioritises the most significant features rather than listing figures. The selected data support these observations, and the report avoids unsupported explanations about why nutrient consumption differs between meal categories. Meeting the minimum word count is necessary, but does not by itself guarantee a particular band score.
2. Coherence and Cohesion
The four-paragraph structure progresses logically from the introduction and overview to two detail paragraphs organised by nutrient patterns. Sodium and saturated fat are discussed together because dinner has the highest proportion of both, whereas added sugar is treated separately because snacks have the largest share.
Linking expressions clarify relationships between observations:
- Overall — introduces the main patterns in the overview.
- whereas — contrasts dinner's shares of sodium and saturated fat with snacks' share of added sugar.
- By contrast — highlights breakfast's relatively small proportions of the three nutrients.
- Regarding — establishes the focus of the first detail paragraph.
- By comparison — introduces a comparison with breakfast.
- A different pattern emerges — signals the transition to added sugar.
- while — connects the final comparison between lunch and breakfast.
The grouping and progression make the report easy to follow. Effective cohesion depends on clear relationships between ideas, not on using as many linking expressions as possible.
3. Lexical Resource
The report uses vocabulary appropriate for describing proportions, rankings and comparisons in pie charts. The expressions are generally natural and precise, without relying on unnecessarily complex wording.
- proportions / shares — describe the relative amounts attributed to each meal category.
- accounts for — expresses the proportion represented by a category.
- contributes — describes a category's contribution to the total for a nutrient.
- ranks second — identifies the second-highest category.
- considerably lower — emphasises a clear difference in proportion.
- make up — describes a category's share of the total.
- represents — expresses a numerical proportion.
- almost twice the figure — compares snacks' 42% share of added sugar with dinner's 23% share.
The report varies its expressions where appropriate, but some repetition, such as accounts for, is acceptable when the expression remains accurate and natural. Replacing every repeated expression with a synonym is unnecessary; the priority is precise meaning and appropriate collocations.
4. Grammatical Range and Accuracy
The report combines simple and complex sentences to introduce the charts, summarise patterns and compare numerical values. Its grammatical structures support the analysis rather than making the writing unnecessarily complicated.
- Present simple: The three pie charts compare the average proportions... The present simple is appropriate for describing what the charts show.
- Complex sentence with contrast: Overall, dinner accounts for the largest shares of sodium and saturated fat, whereas snacks contribute the highest proportion of added sugar. The conjunction whereas connects two contrasting patterns.
- Parallel comparison with respectively: Dinner has the highest figures for both, at 43% and 37%, respectively. The word respectively correctly matches the figures to sodium and saturated fat in the order mentioned.
- Participial construction: Lunch ranks second, accounting for 29% of sodium and 26% of saturated fat. The phrase accounting for adds supporting details concisely.
- Compound sentence: Snacks contribute the same proportion of sodium as breakfast, but their share of saturated fat is higher, at 21%. The conjunction but connects two related observations and highlights their contrast.
- Comparative expression: Snacks make up 42% of the total, almost twice the figure for dinner, at 23%. The comparison communicates the relative difference without repeating the same sentence structure.
- Compound sentence with while: Lunch represents a further 19%, while breakfast has the smallest share, at 16%. The conjunction while connects two contrasting proportions.
These examples demonstrate a useful range of structures, accurate comparisons and generally controlled grammar. However, grammatical range and accuracy must be assessed across the complete report; complex structures alone do not guarantee a high band.